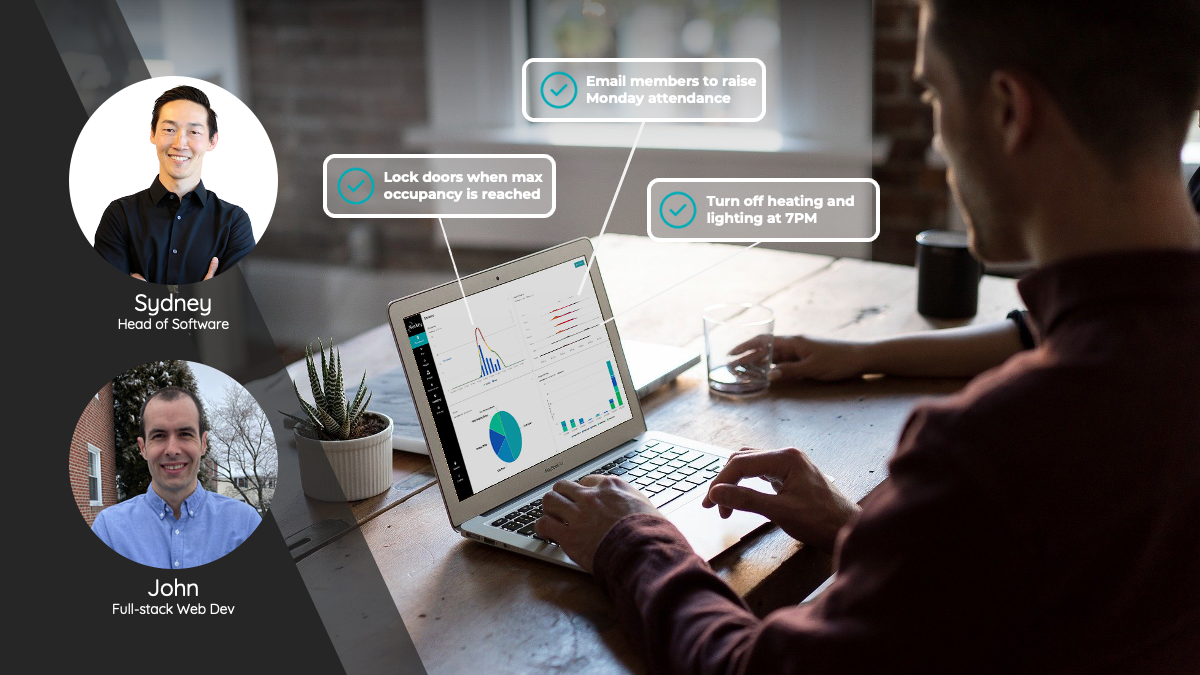
Meet Sydney and John, the faces behind the occupancy and spatial intelligence tool the Nexkey Dashboard
Two years ago, our team set out to achieve the goal of replacing keys and keycards with managing access through the cloud. Tens of thousands of users have now benefited from Nexkey to simplify access to their building. The big question then was “What’s next?”
Nexkey was sitting on a lot of actionable data, centered around the heart of any business, for how people move around and utilize the space. Nexkey’s new Dashboard allows our customers to visualize what is actually happening inside their own walls, so they can make intelligent decisions for their business.
Covid-19 made Nexkey’s occupancy, density and spatial intelligence data even more relevant for businesses wanting to reopen safely in this new normal. Let’s hear from Sydney and John, the people that made Nexkey’s new Dashboard possible, and why it’s such an important addition to the Nexkey platform.
Please introduce yourself!
John - Sure, my name is John Gilligan, I'm a senior full-stack web developer at Nexkey, and I am primarily responsible for the web portal. There are some other web-based projects that we work on, but my primarily focus is on the customer facing web portal.
I've been doing web development for a while now. Most recently working with an electronic component manufacturer. Then also I have experience working for e-commerce sites.
A big update to the web portal this year has been the new Dashboard.
Sydney - Hi, I'm Sydney Pang, the head of software at Nexkey. I lead the software team and define our software products.
Before Nexkey I worked at a company called Sophos, which is a security software company. And prior to that, I was working at Mojave Networks, which was acquired by Sophos. That's how I became a Sophos employee, again doing security software. So my entire career in software has been on the side of mobile application development. I'm always around apps - Android, iOS, what have you.
What is the new Nexkey Dashboard and how does it work?
John - I like to think of the Dashboard as an analytical visualization of your audit trail at a high level.
We already provide a lot of this data, found on the Dashboard, in an audit log format, which is a running list of unlocks and happenings. We are taking that information and putting it in a format that will allow you to do analysis in a way that is much easier to digest than seeing a full text audit log.
We provide a library of different Dashlets, five at launch, we've identified as valuable. Each Dashlet can be used to customize various reports. We plan to expand this library to offer more Dashlets, and allow a custom query of data for things that you might not be able to find in the library.
Sydney - Like John said, we have a lot of information about how the system is being used because we are cloud-based, which tells a story about what's going on, and even what’s not going on in the space. We wanted to give that back to the customer.
We thought there was a better way to visualize that data, not just making it pretty, but actually making it in a form that people can take action on. Insights that weren't able to be seen before, when you put it on a graph, it becomes much more obvious that there are trends.
There is something about the behavior of how people use a building or a door that can be actionable, for example, when to do maintenance on the building, or when to turn on and off heating and lighting which can translate to energy savings. Businesses reopening during COVID may even decide to lock the doors until occupancy reaches a safe level again.
We're just kind of scratching the surface as far as what is possible. We want to allow our customers to make use of the data in new ways which works for their business.
So, that's what the Dashboard is to me.
Why did you guys see the need to create this new Dashboard?
John - We do extremely well at access control - letting people configure who has access, who doesn’t have access, and then letting the right people in and so forth. This just further strengthens our offering by empowering those customers to look at the data that comes from Nexkey in a performance-based way. They can make assessments about different things happening in their business like when the building is most crowded, and make some decisions about when to schedule certain things, or even how to expand the business.
The Dashboard really gives you this lens into the Nexkey platform to look at the performance of your space with respect to people accessing it. This just opens up a whole different value in the Nexkey offering.
Sydney - A lot of our customers come from a world where they're migrating over from physical keys so even electronic access control in itself is something new to them, let alone cloud-based access control. It is like they're actually jumping over a previous iteration of access control seen in the industry, on-premise systems or traditional key card systems, which lack this level of insights.
So it is interesting to me to exemplify what value they are getting. They may come to Nexkey to solve the key management problem that they have, but along with that jump, they also are getting all of this other information that we provide through the Dashboard and the rest of our product.
So to me, Dashboard is just another realization of how much value the cloud-based access control system like ours can provide for our customers, especially ones that come from the physical key world.
How do you see Dashboards playing a role with people coming back to the office after the COVID-19 pandemic?
John - Two of the five library items that we created and launched with are related to capacity in a space and then also the density of a space. Like Sydney mentioned earlier, one thing is putting this kind of data on the chart. Okay, that's interesting, now I see it in the chart as opposed to text, but we knew that we could go even further.
With the space utilization, we wrapped some controls around that chart so that you can tell the chart, for example, how many people should be allowed in that space at one time. That is taking it a step further from just providing the data. We're also providing tools for somebody who's thinking about capacity, which is absolutely relevant in this post-COVID -19 world.
The Dashboard allows customers to produce valuable reports to give them insights into how to run their business. We’re certainly constantly thinking about other ways that we can add reports that would benefit different concerns that people have with COVID-19.
Sydney - It remains to be seen what the post-COVID-19 world looks like but I think it's safe to say that this experience will be fresh in people's memories for quite some time after what happened this past year. I think it's relatively acceptable to think that people will be very cognizant of how many people are in a building now. With social distancing, remote working, and just the heightened level of the practices we're taking part in, I wouldn't be surprised if they're here to stay for quite some time.
A few things in the Dashboard become really important, specifically the occupancy and space utilization Dashlets. You can estimate how many people are there within the last 12 to 24 hours. Nexkey will let you know when you get near to that threshold, when you cross it and when you severely cross it, and when it's safe to have more people go in. You can even project what will happen in the space for upcoming weeks, based on what happened in the past.
There are really good features that we hope people will get a lot of use out of and maybe hopefully save some lives.
Final Thoughts
John - We are really excited about the way the Dashboard feels and works. Giving customers flexibility to customize and position reports really does help them analyze the best practices for their business.
Sydney -
You know, I am constantly pouring over graphs and other types of data-driven things. In my personal life, I like to do triathlons. So for me, analyzing data and measuring my performance is something that I very much enjoy. I think that is part of what motivates me. That's how I know I'm getting better. And that's how I know that the changes that I make to let's say my training regimen or my diet are making an impact, or if they're adversely affecting the results.
Dashboard to me is just extending some of the stuff that I already do in other aspects of my life, to our Nexkey product. And so it felt like a very natural thing. And I think that's what made this, especially with John, very enjoyable and continues to be a very rewarding experience.
I was very encouraged by the amount of traffic that we got when we made the announcement about the Dashboard. We definitely want to make this as great of a product and feature to add on to our existing access control service as possible.
We hope everyone loves it.